TRON Price Analysis of March 13, 2025: TRON Drops from $0.2260 to $0.2200; Is a Recovery Ahead?

0
0

Are you tracking TRON and wondering why the TRON price trend shows bearish sentiment amid bullish momentum in Bitcoin? Then, this TRON price analysis is for you. The. As we go through the TRON price analysis, we will explore different patterns and how the TRON price today reacted to them. We will determine the critical support and resistance levels and whether the TRON price trend would be able to break these levels. Without any further delay, let’s dive into the TRON price analysis and determine where today’s TRON price might trade.
TRON Price Analysis of the Last 24 Hours
In the early hours of March 12, the price marked the high at $0.2263 when the TRON price was in a converging triangle. The converging triangle broke out to the downside at 01:55 UTC, corroborated by a death cross in MACD. The price formed a channel, which pushed the price down to the level of $0.2220. In the meantime, the RSI dropped below the level of 30. A golden crossover appeared in the price at 05:10 UTC as the price broke out to the upside from a downward-moving channel at 05:15 UTC.
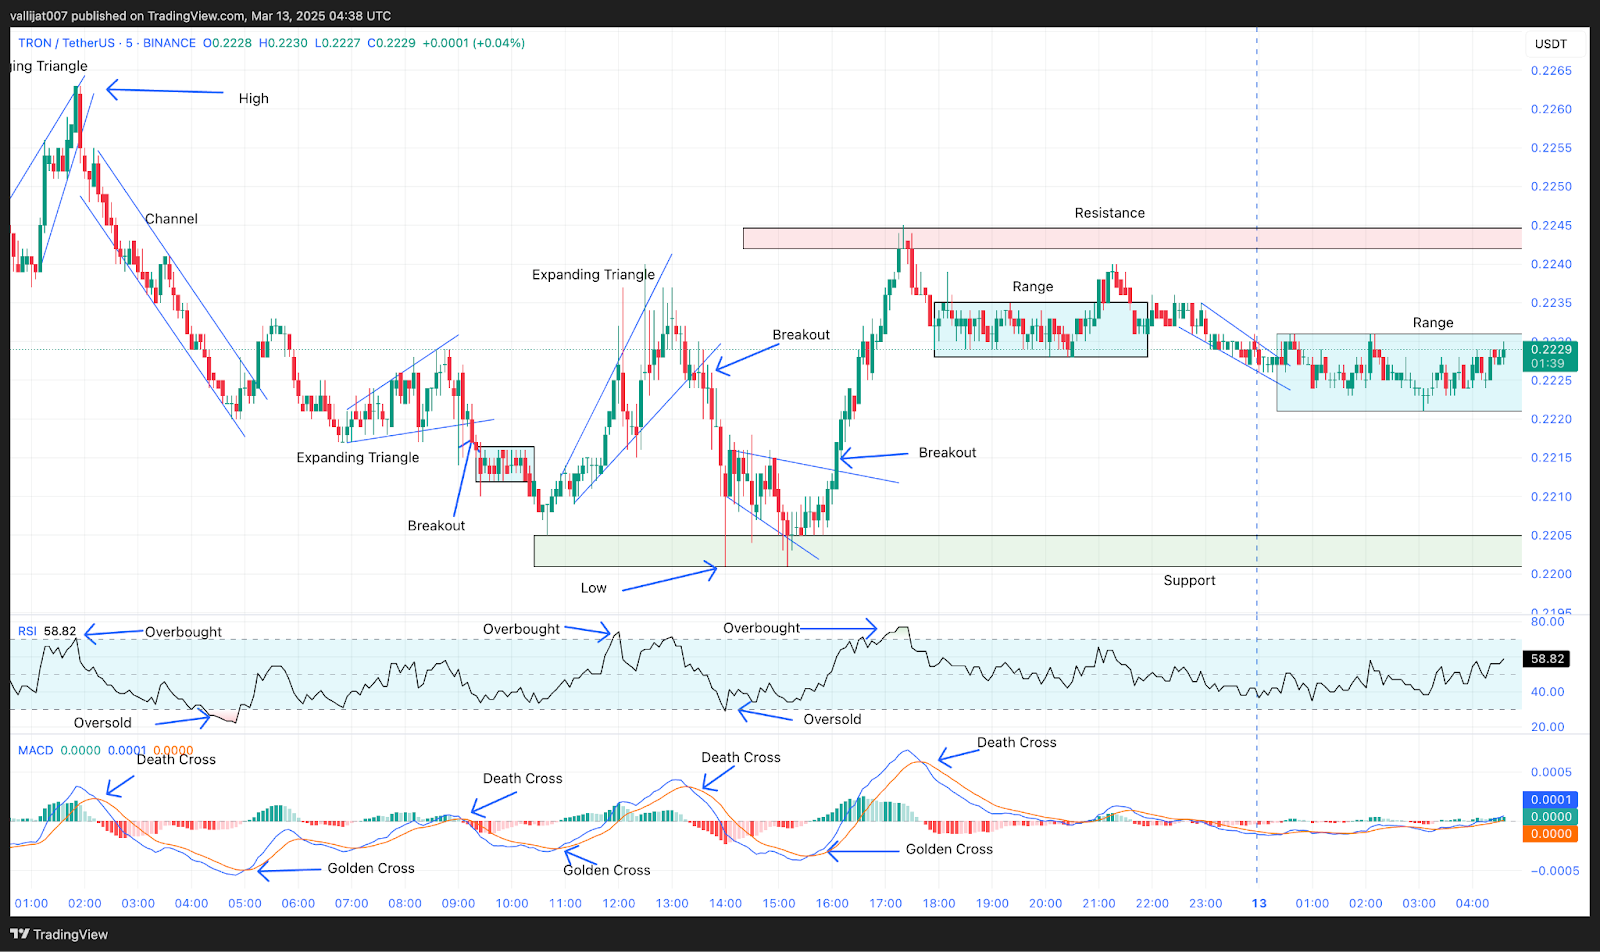
Chart 1: Analysed by vallijat007, published on TradingView, March 13, 2025
The price failed to form a channel; instead, the breakout failed, and an expanding triangle pattern appeared in the price, which broke out to the downside at 09:15 UTC, corroborated by a death cross in MACD. The price formed a minor spike and a minor range, which again broke out to the downside at 10:20 UTC, but the downside breakout failed as a golden cross appeared in MACD. The price spiked to the upside, forming an expanding triangle pattern, which pushed the RSI above the level of 70, indicating a reversal or at least a pullback.
TRON Price Movement: Range-Bound Trading Continues Amid Failed Breakouts
The price broke out from the expanding triangle to the downside at 13:25 UTC, further supported by a death cross in MACD. At the same time, the price marked the low of the day at $0.2200. Another expanding triangle appeared near the low of the day, which broke out to the upside at 16:05 UTC, corroborated by a golden cross in MACD.
The price pushed to the high, forming a spike but failing to form a channel. Instead, a range appeared in the price. The range broke out to the upside in an attempt to form a higher high at 21:00 UTC, but the breakout failed. A minor downward-moving channel appeared in the price, which broke out to the upside at 00:30 UTC, but again, the breakout failed. The price is currently trading in a range.
TRON Price Consolidation: Awaiting a Breakout for Clear Trend Direction
As analyzed above, the TRON price today consolidates between critical support and resistance levels. As the whole crypto market consolidates, the chances of TRON trading in a range-bound market further increase. In the higher timeframe, the TRON price trend is currently in a trading range, and a clear trend is only visible after a strong breakout of critical resistance and support levels. Traders and investors are encouraged to analyze the price trend by themselves, as the crypto market is subject to potential risk.
The post TRON Price Analysis of March 13, 2025: TRON Drops from $0.2260 to $0.2200; Is a Recovery Ahead? appeared first on Coinfomania.
0
0

 Manage all your crypto, NFT and DeFi from one place
Securely connect the portfolio you’re using to start.


0
0

