Onyxcoin (XCN) Nears Oversold as Monthly Correction Reaches 30%

0
0


Onyxcoin (XCN) has been under heavy selling pressure, dropping more than 11% in the last seven days and over 30% in the past month. Multiple indicators now reflect this sustained weakness, with momentum and trend signals leaning decisively bearish.
The RSI is nearing oversold levels, while the ADX shows the downtrend is gaining strength. Unless buyers step in soon, XCN could face deeper losses before any meaningful recovery attempt takes shape.
Onyxcoin RSI Is Almost Reaching Oversold Levels
Onyxcoin’s Relative Strength Index (RSI) has dropped sharply to 31.63, down from 48.72 just a day earlier. This significant decline brings it closer to the oversold threshold and highlights the growing bearish momentum.
The RSI has now remained below the neutral 50 mark for the past 12 consecutive days, signaling that bearish sentiment has been dominant throughout this period.
This ongoing weakness suggests that sellers continue to control the market, and the latest drop may indicate a deepening of the current downtrend.
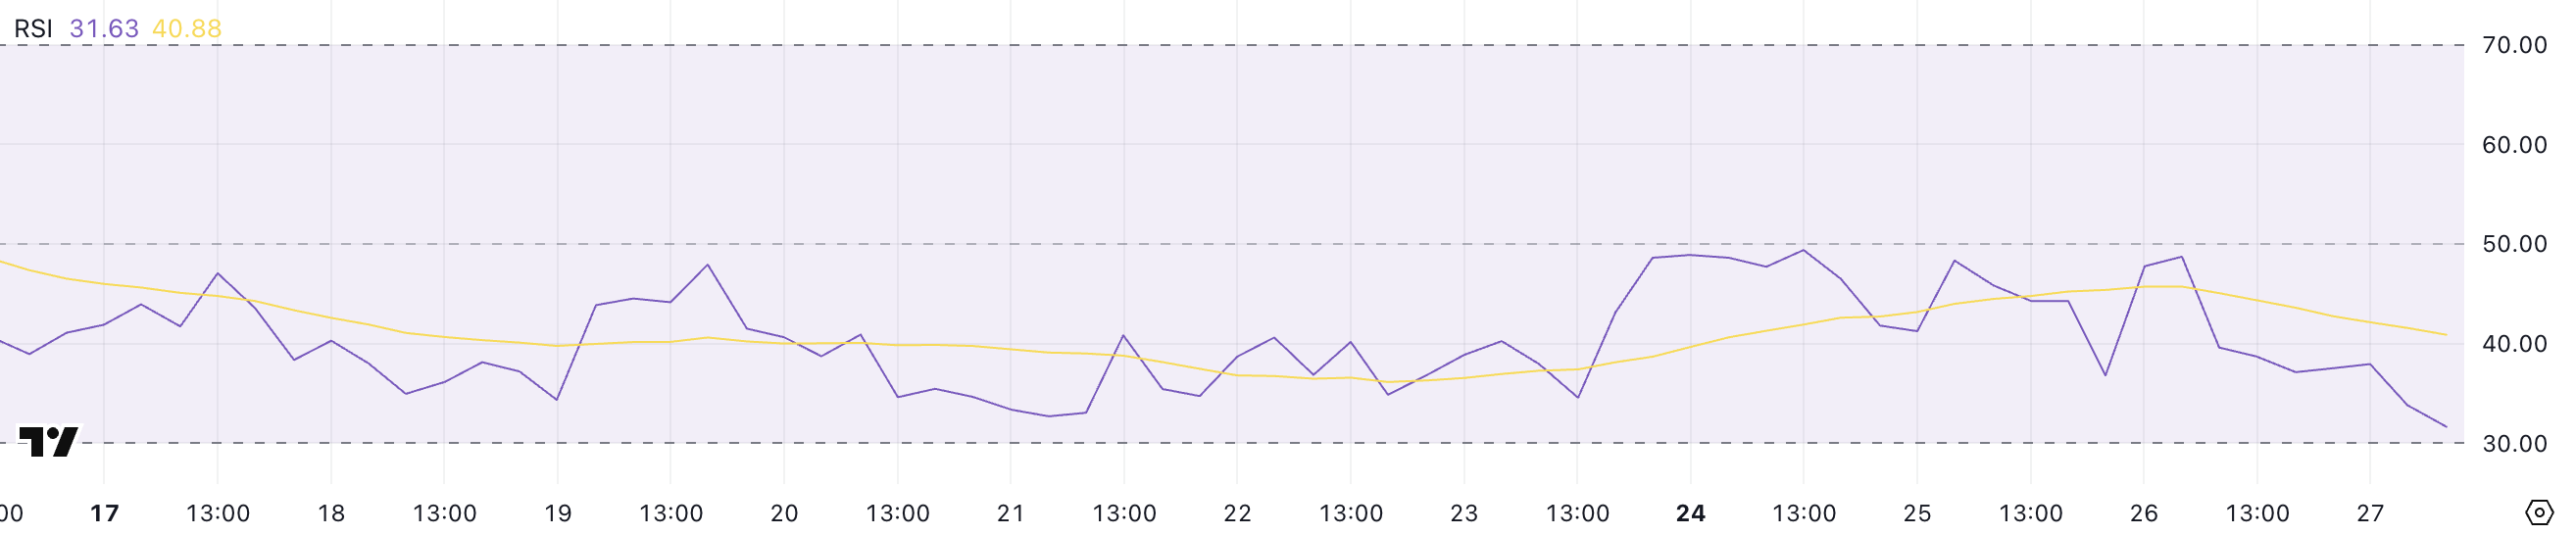 XCN RSI. Source: TradingView.
The RSI is a momentum oscillator that measures the speed and change of price movements on a scale from 0 to 100. Readings above 70 typically suggest an asset is overbought and may be due for a correction, while values below 30 indicate oversold conditions that could lead to a potential rebound.
XCN’s current RSI of 31.63 puts it just above oversold territory, which means a bounce is possible—but far from guaranteed. If bearish pressure persists and the RSI dips below 30, it could signal panic selling or capitulation.
On the other hand, a quick recovery in RSI above 40 could hint at fading selling pressure and the early signs of a trend reversal.
XCN ADX Shows The Downtrend Is Getting Stronger
Onyxcoin Average Directional Index (ADX) has surged to 24.17, up from 12.86 just a day ago, signaling a rapid increase in trend strength.
The ADX measures the intensity of a trend, regardless of its direction, and this sharp rise suggests that the current downtrend is gaining traction.
With XCN’s price already moving lower, the strengthening ADX reinforces the idea that bears are firmly in control, and the downward momentum may continue in the near term.
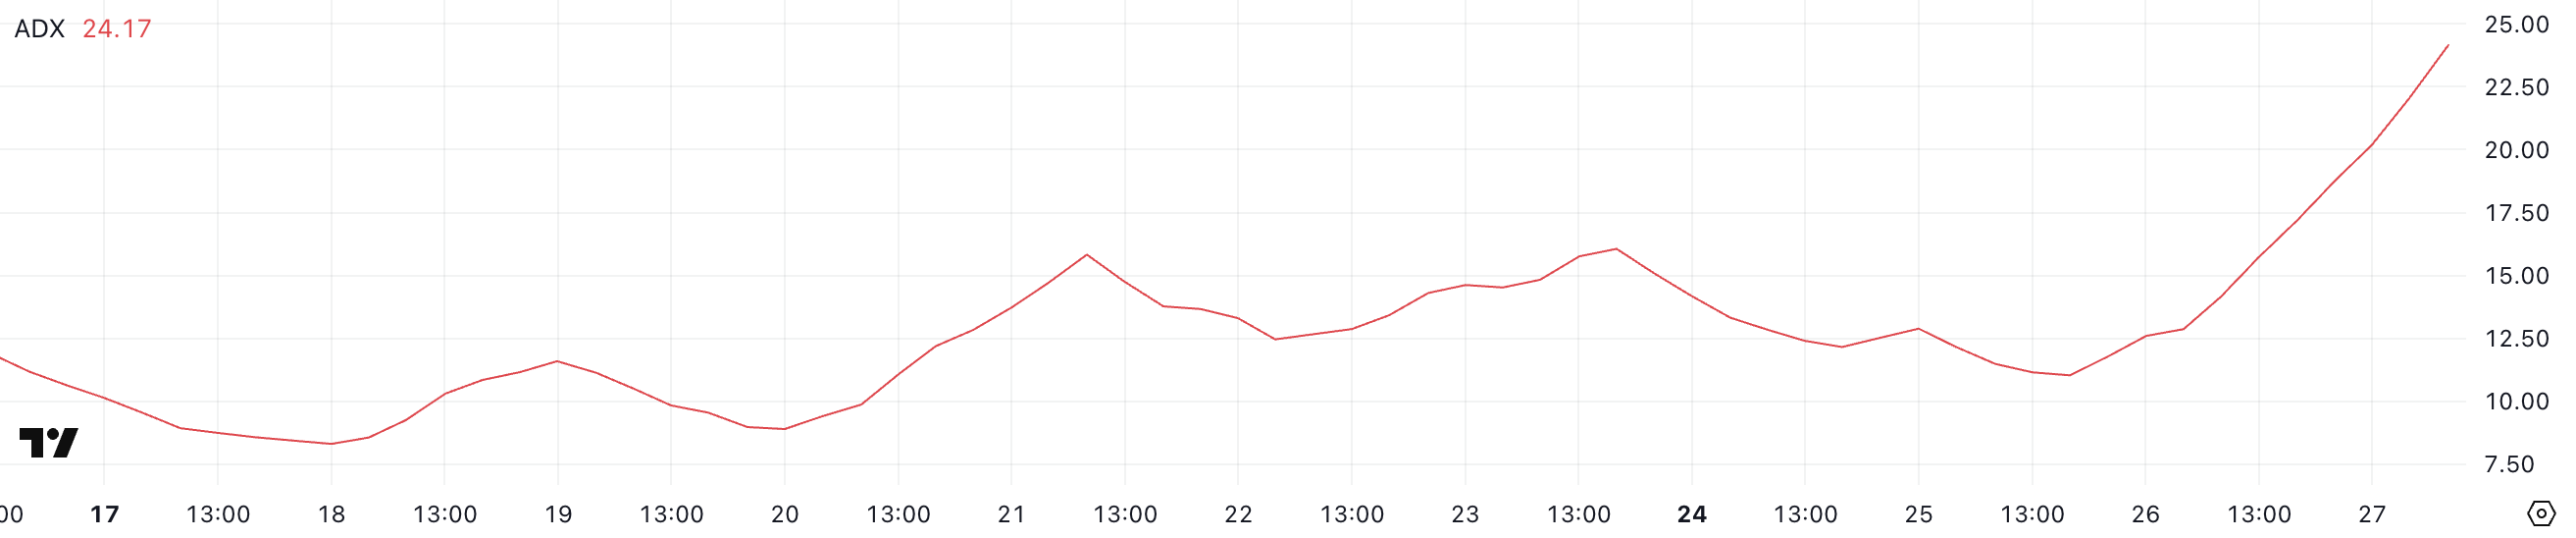 XCN ADX. Source: TradingView.
The ADX operates on a scale from 0 to 100, with readings below 20 typically indicating a weak or non-existent trend. Values between 20 and 25 point to a trend that may be starting to build, while anything above 25 signals a strong, established trend.
XCN’s current ADX at 24.17 is right on the edge of this critical threshold, suggesting that the downtrend is transitioning from early-stage to potentially stronger territory.
If the ADX continues rising above 25 while the price stays in decline, it would confirm that sellers are driving a more powerful move lower, and any bullish reversal attempt could face strong resistance.
Onyxcoin Correction Could Continue
Onyxcoin EMA lines are currently aligned in a bearish formation, suggesting that the downtrend may persist in the short term.
If the bearish momentum continues, XCN could retest the support level at $0.0083, a critical zone that previously acted as a floor.
A breakdown below this level would likely expose the token to further downside, potentially causing it to fall to $0.0051, its lowest price since January 17.
The current EMA structure highlights weakening bullish pressure and increasing vulnerability to additional selling.
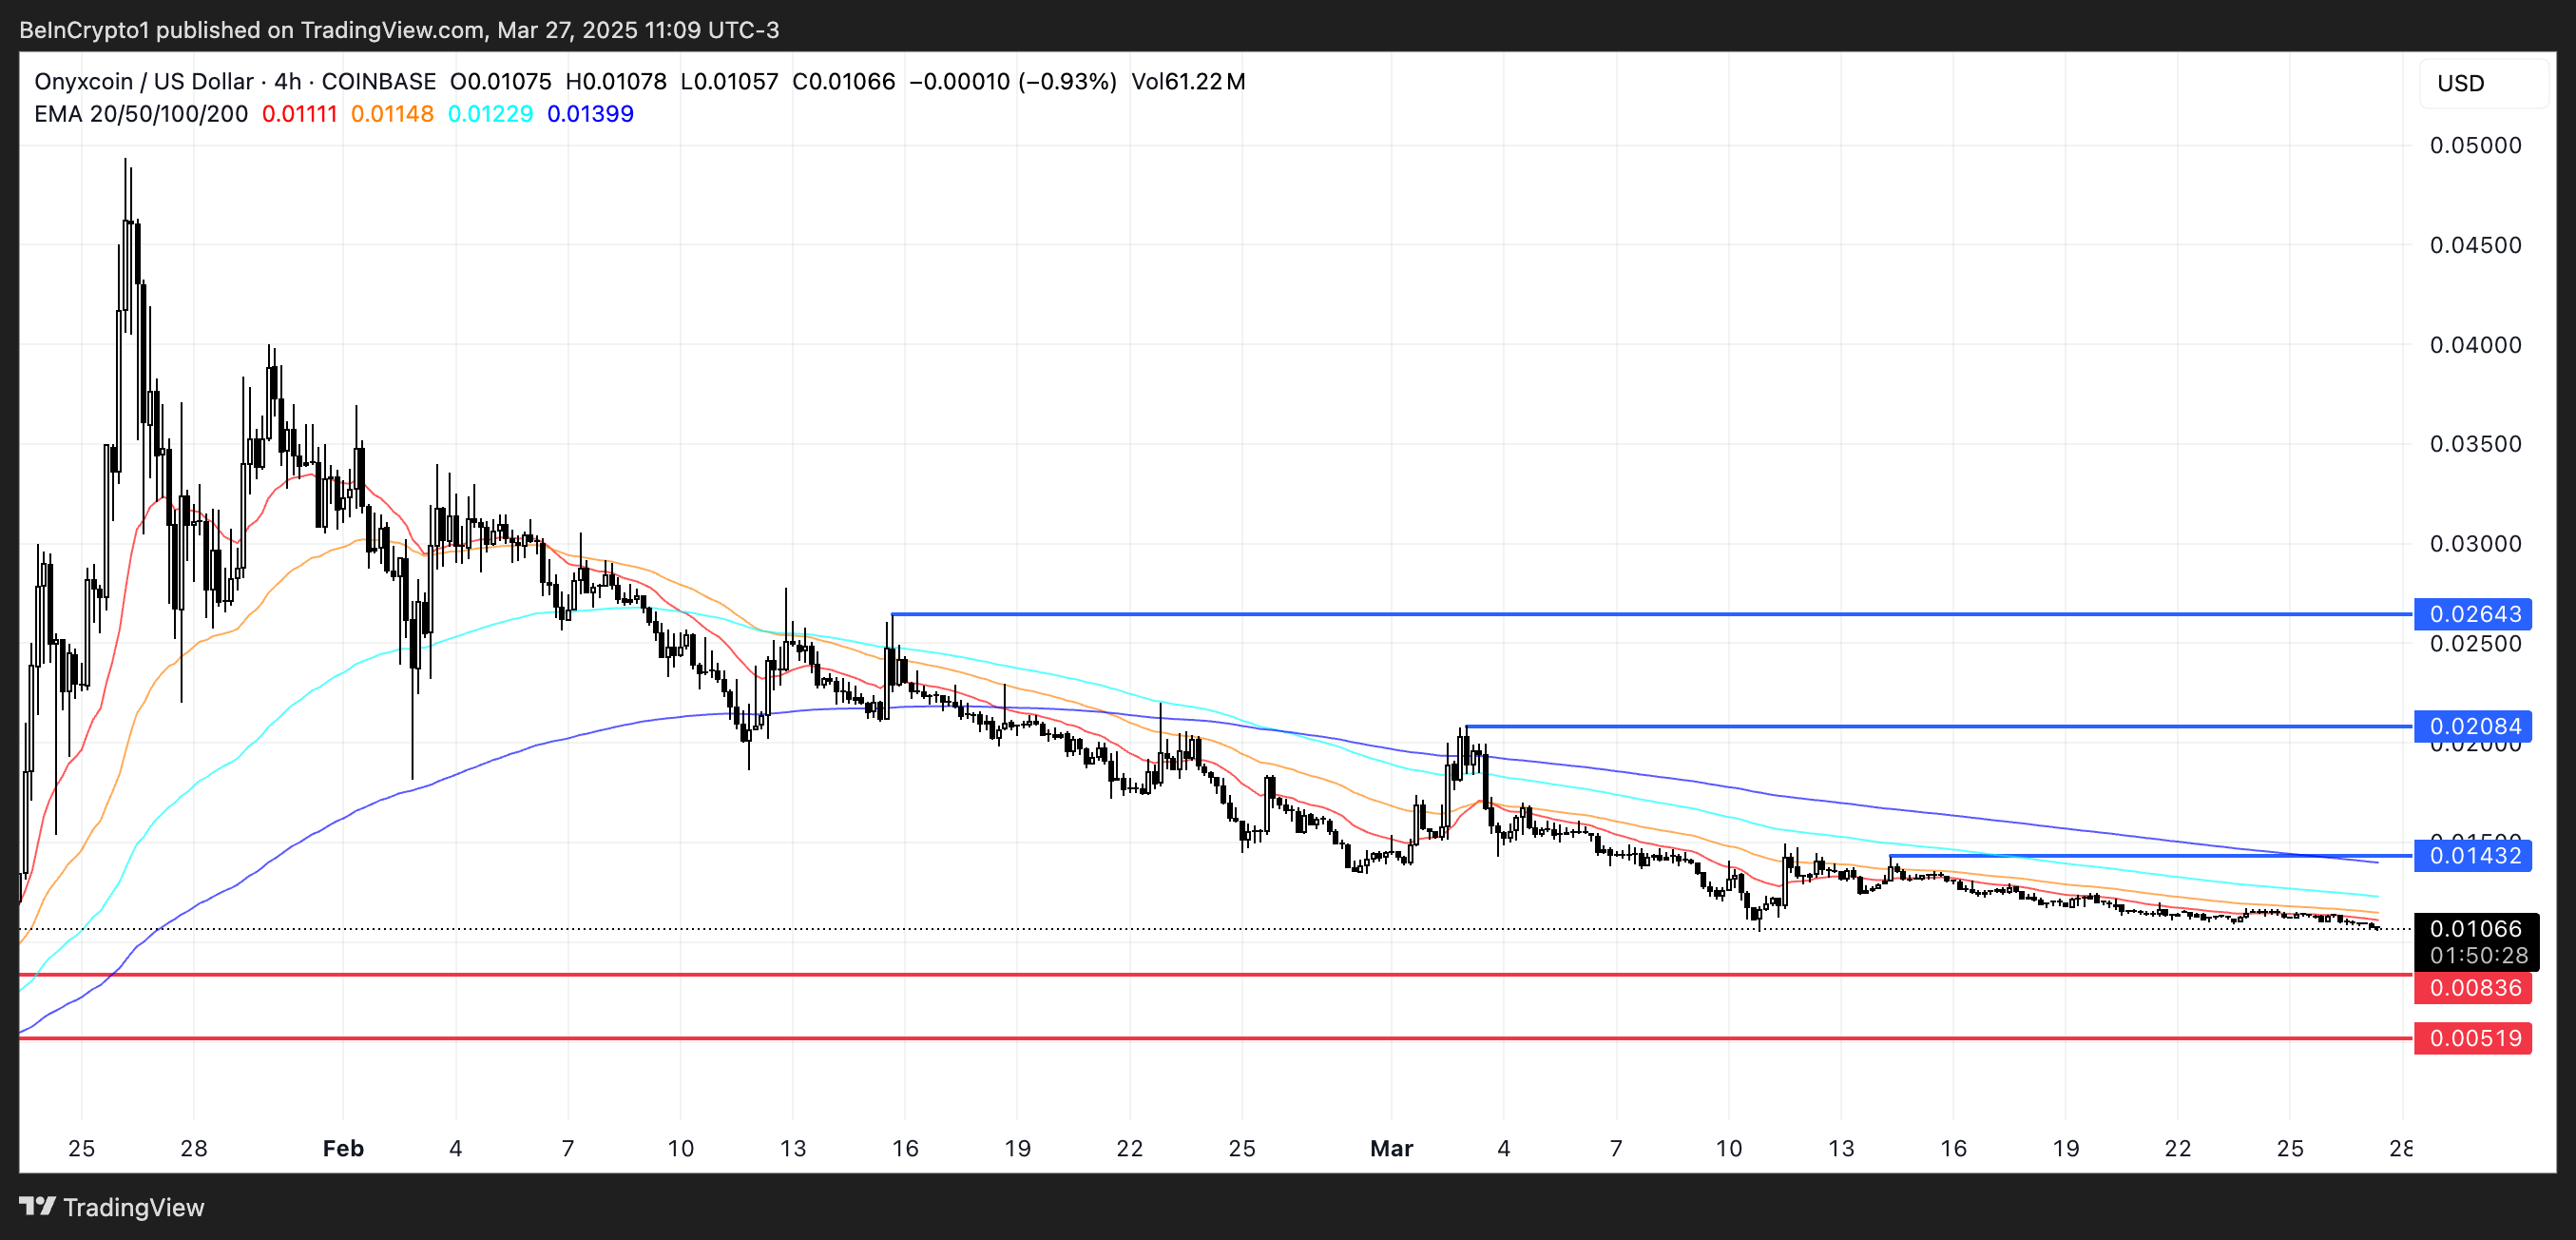 XCN Price Analysis. Source: TradingView.
However, there’s still a path to recovery if Onyxcoin can regain the strong momentum it showed at the end of January, when it was one of the most talked-about altcoins in the market.
A reversal could take XCN back to test the resistance at $0.014, and a successful breakout above that would signal renewed bullish strength.
If buyers push further, price targets at $0.020 and even $0.026 will become relevant—levels not seen since mid-February.
0
0


 Manage all your crypto, NFT and DeFi from one place
Securely connect the portfolio you’re using to start.

0
0


