USDT Dominance Is Dropping—Here’s What That Means for Bitcoin and Altcoins

0
0


The crypto market has never seen such an abundance of Tether (USDT) as it does now. As a result, the Tether Dominance ratio (USDT.D) has become one of the most closely watched indicators among crypto investors.
USDT.D measures USDT’s dominance relative to the total crypto market capitalization. A decline in USDT.D is often seen as a sign that investors are shifting behavior, choosing to spend USDT to buy altcoins and Bitcoin.
Symmetry Between BTC and USDT.D Signals a Bullish Outlook
According to CoinMarketCap, Tether’s market cap hit a record high in April 2025, reaching $145.6 billion—an increase of over $8.5 billion since the start of the year.
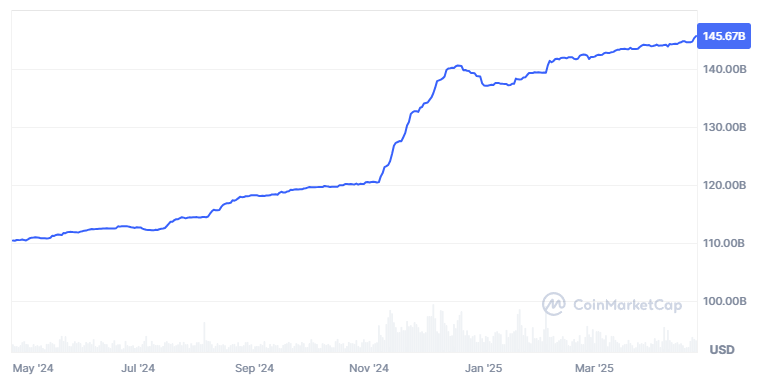 Tether (USDT) Market Cap. Source: CoinMarketCap
Tether printed more than $1.6 billion in April alone, bringing it into circulation. If USDT’s market cap represents the available capital in the market, then USDT.D serves as an early indicator of whether that capital has started flowing into altcoins and Bitcoin.
USDT.D has shown signs of declining recently, which has sparked speculation about an upcoming market-wide recovery.
Max, the founder of BecauseBitcoin, highlighted a striking symmetry between Bitcoin’s price chart and the USDT Dominance index. In a post on X, Max noted that every time USDT.D drops, Bitcoin tends to surge—and vice versa. At the same time, both have broken through their respective support and resistance levels.
Based on historical patterns, he predicted that Bitcoin could see another price rally in the coming month, while USDT Dominance may continue its decline from the resistance level around 5.5%.
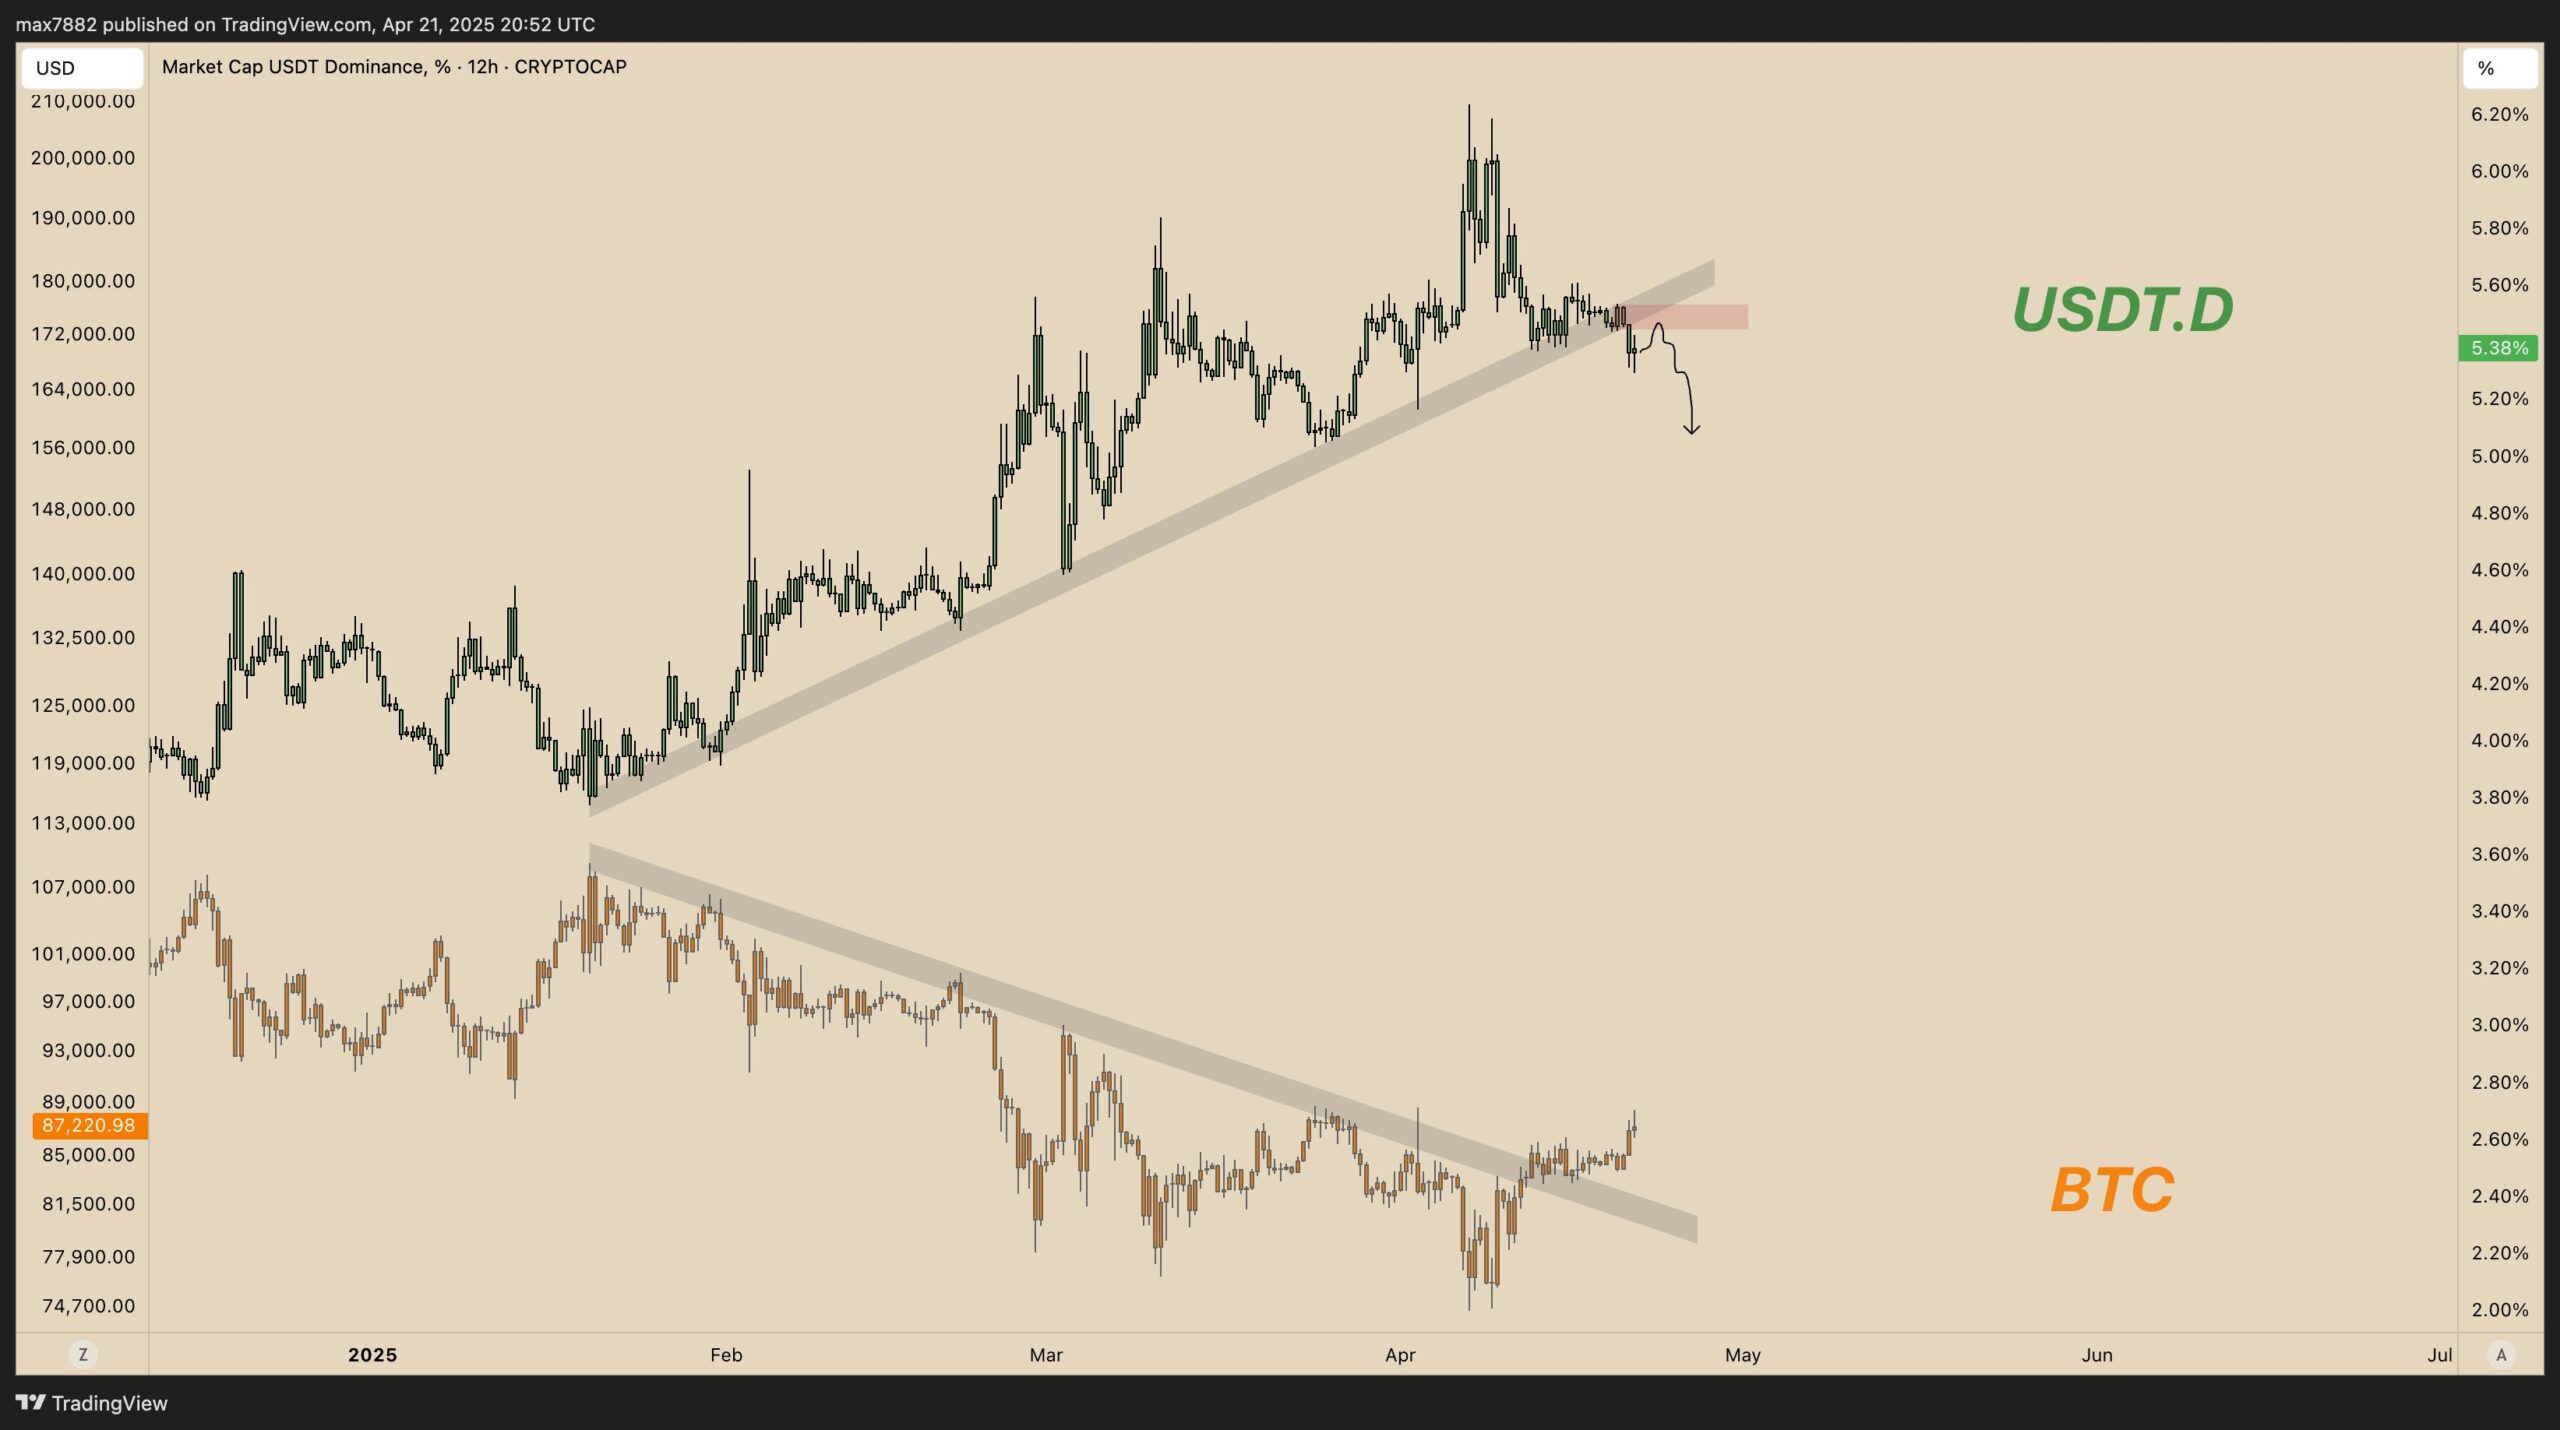 Tether Dominance (USDT.D) vs Bitcoin Price. Source: Max
“I think this really should be the breakdown for USDT.D & subsequently the push higher for BTC,” Max said.
Combined Stablecoin Dominance Also Sends Bullish Signals
The combined index of USDT.D and USDC.D (USDC Dominance), representing the dominance ratios of the two largest stablecoins, shows early positive signs.
Investor Cryptosahintas revealed that the combined USDT.D + USDC.D index reached a critical resistance level of 8% this month. This is a bullish sign for altcoins. When stablecoin dominance reacts to resistance, it often signals that capital may be preparing to flow into altcoins, potentially triggering a strong price rally.
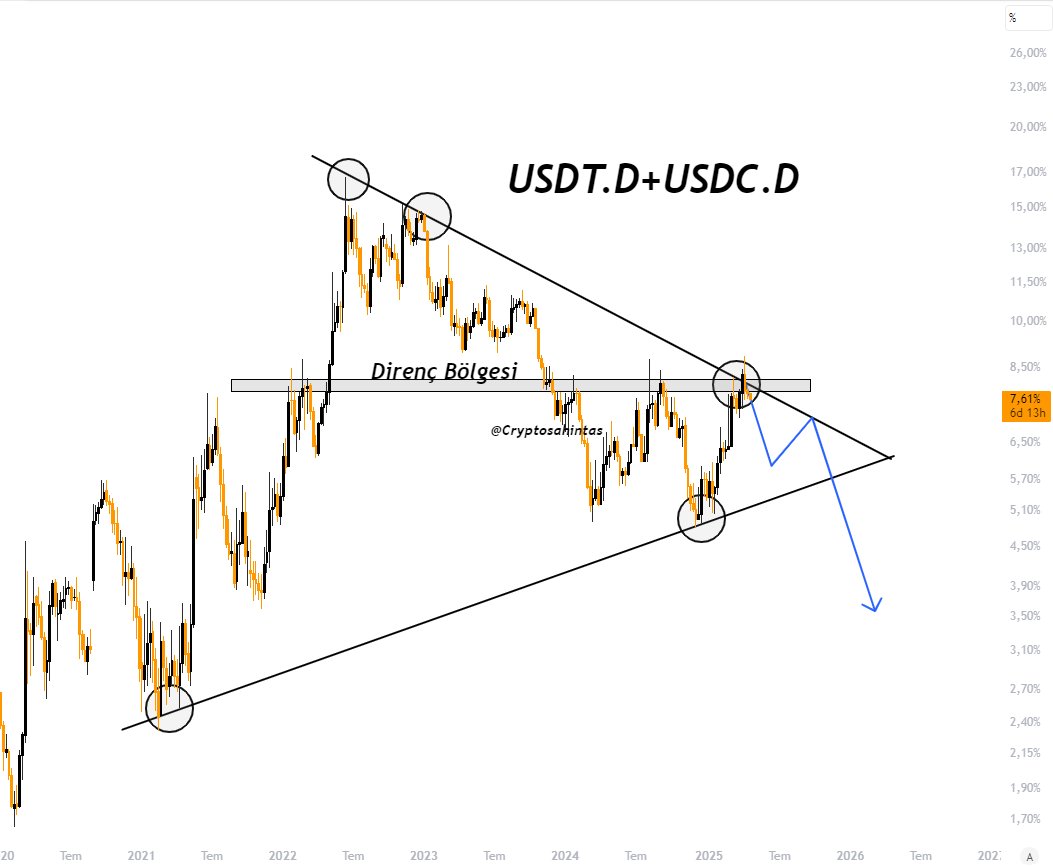
Furthermore, Cryptosahintas predicted that this combined index could drop to 3.5%, possibly extending into next year.
These viewpoints are further supported by current market sentiment. Investors have noticed that altcoin prices have fallen significantly and are actively buying back in. This week, the Fear and Greed Index shifted from fear to greed, confirming this change in sentiment.
At the same time, total market capitalization recovered by 6%, rising from $2.68 trillion to $2.84 trillion.
Not all predictions about the dominance of stablecoins are positive. According to a recent report from 10X Research, while the stablecoin minting indicator has increased, it has not yet returned to its previous highs. The researchers at 10X Research emphasize the importance of exercising caution regarding the current market recovery.
0
0


 Manage all your crypto, NFT and DeFi from one place
Securely connect the portfolio you’re using to start.


0
0

