Bitcoin’s Price Climbs Toward Record Highs, But On-Chain Activity Signals Caution
0
0

- Bitcoin price rises, but active addresses decline, signaling lower on-chain engagement.
- Persistent exchange outflows show long-term accumulation and reduced sell pressure.
- Santiment data confirms falling participation despite record-high BTC prices.
Bitcoin’s price continues its upward momentum in 2025, yet on-chain engagement data shows a different tale. Recent analytics data from IntoTheBlock, Coinglass, and Santiment indicate a widening gap between price growth and user activity, with a notable decline in active addresses across the Bitcoin network.
According to IntoTheBlock, the number of active Bitcoin addresses surged past 800,000 this week. However, this figure remains far below peak levels observed during previous bull cycles. From 2019 through late 2021, active addresses moved largely in tandem with Bitcoin’s price, with higher transaction activity corresponding with market rallies.
That pattern shifted starting in 2022. While Bitcoin’s price climbed above $70,000 in 2024 and remains strong above $60,000 into April 2025, active address counts have gradually declined. IntoTheBlock’s data shows a clear divergence, marked visually by a red arrow in the chart.
Some of the analysts suggest the daily active users might be due to the Lightning Network effect, while others assume people change from active trading to more passive investment.

The decline suggests reduced retail participation or concentration of Bitcoin ownership, with fewer unique users driving overall activity on the chain. Regardless of the underlying cause, the data shows that a proportional rise in network engagement does not currently support rising prices.
Exchange Netflows Reveal Accumulation Trend
Additional data from Coinglass tracks Bitcoin’s daily netflows across major spot exchanges from July 2023 through April 29, 2025. The chart highlights persistent negative netflows, represented by dominant red bars, indicating more Bitcoin is leaving exchanges than entering. This outflow trend intensified after January 2024, with peaks in late December and February.

Such large outflows are generally associated with increases in short-term prices, which suggests that long-term holders are accumulating assets. On the other hand, inflows, marked by green bars, are less frequent and less abundant. Such inflows were observed occasionally in October, November, and early March, which may have been driven by profit taking or positioning for volatility.
The chart below reveals a continuously rising trend of Bitcoin’s price for seven years, before it reached $90,000. Outflows coincide with higher prices; therefore, in line with broader market sentiment, there is a decreasing near-term pressure to sell.
Santiment Data Underscores Shifting Participation
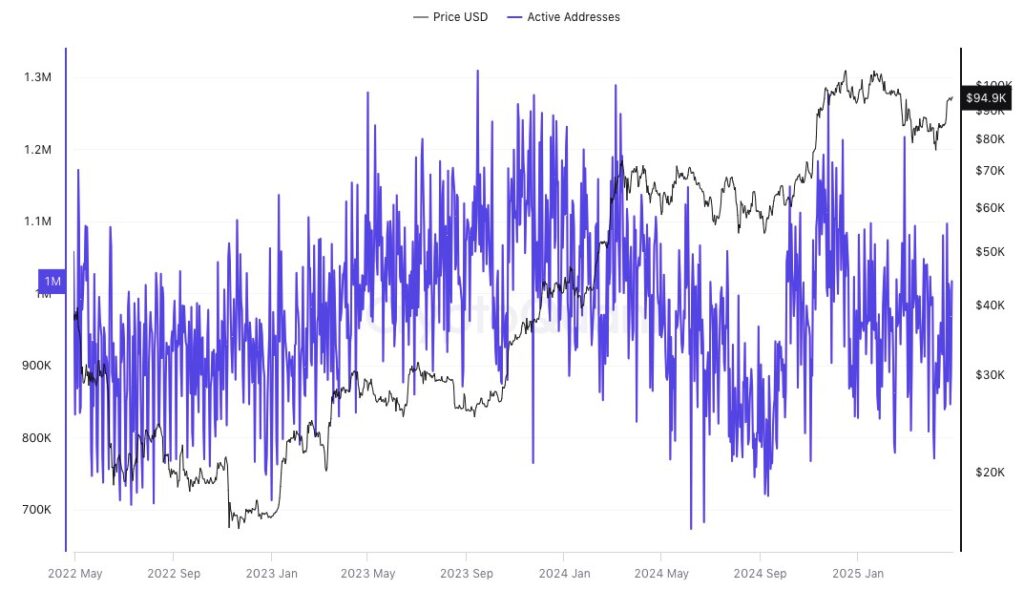
Other data from Santiment includes Bitcoin price and address-level activity between May 2022 and April 2025. Both values increased and decreased in parallel in the beginnings of the dataset, to represent usage in the network and value in the market perfectly.

On the other hand, the active address count began to increase from mid-2023 despite the low price volatility. This trend began reversing in late 2024 as its price rose above $90K while the activity of addresses was considerably low; it frequently dipped below $800K.
This shift claims that broader participation in the network does not support the more recent price uptrend. Rather, it might mean that fewer people are transacting or activity is simply moving off-chain. This decline has been attributed to various reasons, ranging from client base shifts to dedicated on-chain and second-layer dependent wallets.
0
0
 Manage all your crypto, NFT and DeFi from one place
Securely connect the portfolio you’re using to start.


