A Look At Dogecoin’s Recovery Path 70% Below All-Time High

0
0

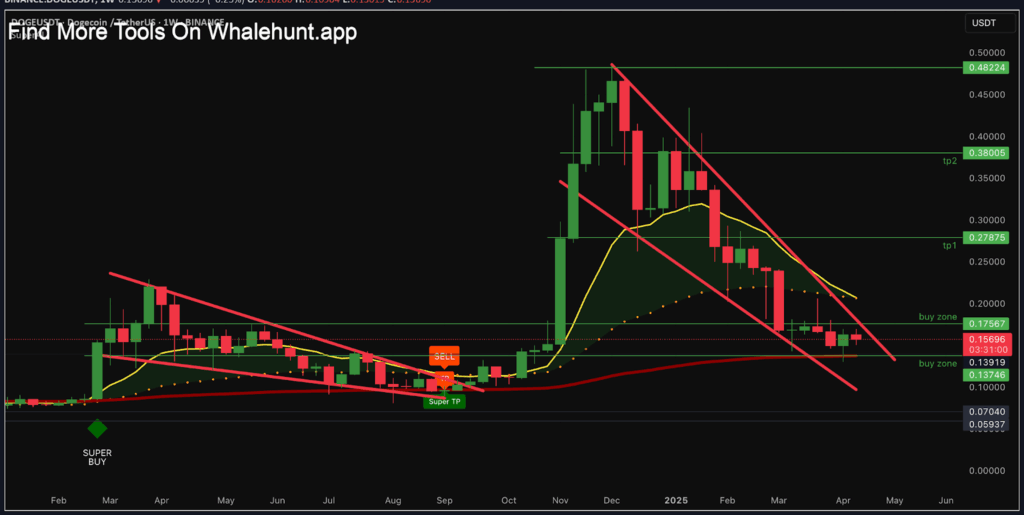
After dropping over 70% from its 2021 high of $0.48, Dogecoin (DOGE) entered a long-term consolidation phase.
A falling wedge pattern developed in the current price structure indicates that DOGE could start an upward breakout based on historical patterns.
DOGE maintained a trading price of $0.15 on April 20. This trading position matched the 200-day exponential moving average (EMA), which usually acts as an essential support threshold.
Falling Wedge Formation and Current Support Levels
Dogecoin price has shown declining trends in a tightening pattern that started at its peak point.
A price breakout above the wedge resistance, accompanied by high trading volume, usually indicates a market reversal.
The wedge pattern in Dogecoin approaches its apex. Thus, it indicates that the coin will likely experience either an upward movement or a downward shift soon.
Binance data revealed that Dogecoin price maintained its current trading boundaries at $0.175 above $0.137.
Throughout earlier market cycles, this particular range served as one of the prominent locations where investors accumulated DOGE.
According to technical analyst @ali_charts, DOGE’s long-term trajectory remained within a logarithmic growth channel.
The price has respected the structure over several years, bouncing off the midline and upper bounds during past rallies.

DOGE held above the 200 EMA at $0.15, a level often watched by traders to gauge long-term support.
A breakdown below this support zone would likely initiate an additional challenge of the broader support level at $0.135 while suggesting the breakdown of bullish momentum.
Key Resistance Zones and Breakout Scenarios for Dogecoin Price
The resistance point at $0.17 prevented Dogecoin from breaking through multiple upward price movements.
Breaking and reclaiming this zone could lead to further movement toward $0.23 and $0.27.
These levels correspond with past reaction zones and are considered essential price targets if the trend reverses.
If DOGE price breaks out of the wedge, the following price objectives could be around $0.28, $0.38, and $0.48, aligning with earlier profit-taking levels.
On-chain and technical data have shown that these areas attracted large volumes during the previous rally.
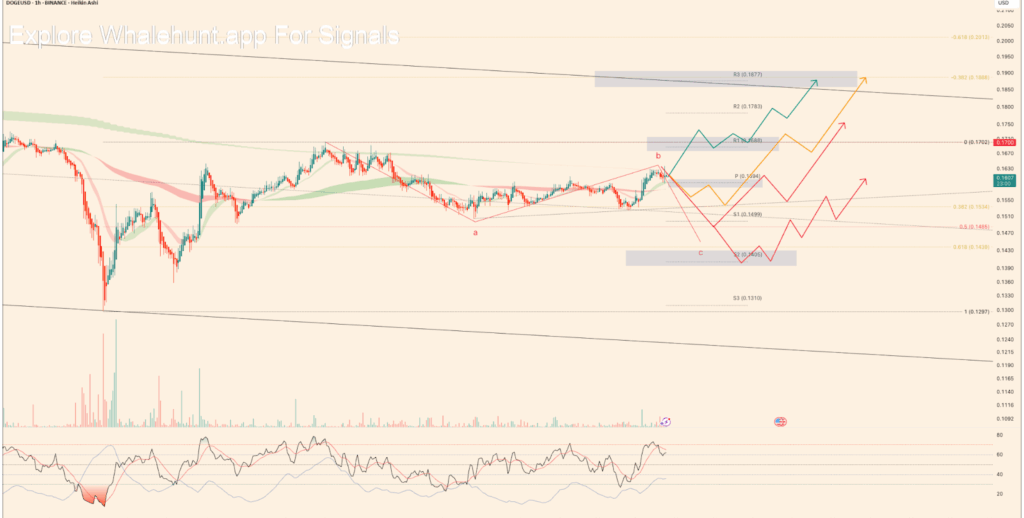
Short-term charts also indicate that DOGE may form an a-b-c corrective wave. It usually precedes a trend continuation.
The RSI on hourly timeframes approached overbought territory during recent rallies. That suggested the possibility of a pullback before any sustainable breakout.
Dogecoin Whale Activity Signals Accumulation Despite Recent Dip
Whale transactions on April 20 revealed an interesting mix of behaviour. At 09:30, DOGE was trading at $0.1585, and whale purchases had decreased by -1.51%.
However, when Dogecoin price dropped to $0.1528 later in the day, whale activity increased by 1.40%.
The largest single transaction was nearly $900,000, suggesting buying interest despite declining prices.

This shift in whale behaviour contrasted short-term sentiment and long-term confidence.
While early trading showed caution, accumulation at lower levels suggested that large holders expected a rebound or long-term recovery.
Data inconsistencies did not prevent DOGE from staying inside its previously defined buying territory.
However, whale accumulation at lower prices indicated stable prices or potential market increases.
Potential Outcomes and Critical Zones to Watch
When writing, DOGE traded near $0.156, with short-term support at $0.149 and $0.140.
The falling wedge breakout could materialize if the price rises above these levels and the volume increases.
If DOGE closes above the wedge resistance line, eyes will be on the $0.23–$0.27 zone.
A drop below $0.135 would likely cancel the bullish scenario. Traders have marked the ideal accumulation range of the $0.135–$0.175 area.
According to market analysts, DOGE must stay above this region so buyers remain in control.
The 0.786 Fibonacci retracement level, currently near $0.157, has recently become an important pivot point.
Fibonacci zones have historically triggered substantial price reactions from DOGE, making them essential locations to track.
Market observers track price movement behavior since its continued movement forms a wedge shape.
Numerous whales and increased volume would indicate a break in the wedge’s upper limit, which could trigger DOGE’s next positive direction.
The post A Look At Dogecoin’s Recovery Path 70% Below All-Time High appeared first on The Coin Republic.
0
0


 Manage all your crypto, NFT and DeFi from one place
Securely connect the portfolio you’re using to start.


0
0
