Cardano’s Decline: What Next for ADA as Short-Term Traders Exit

0
0


Cardano’s ADA has struggled to maintain stability over the past month. It currently trades at $0.70, having declined by nearly 10% over the past 30 days.
The downtrend comes as broader market headwinds weigh on investor sentiment, prompting short-term holders (STHs) to reduce their holding time significantly.
Cardano’s Short-Term Traders Are Selling Fast—Will ADA Find Support?
STHs, referring to investors who typically hold assets for less than one month, have significantly reduced their ADA holding time as bearish sentiment intensifies across the crypto market.
According to data from IntoTheBlock, these investors have reduced their holding time by 12% in the past month, exacerbating the coin’s price decline.
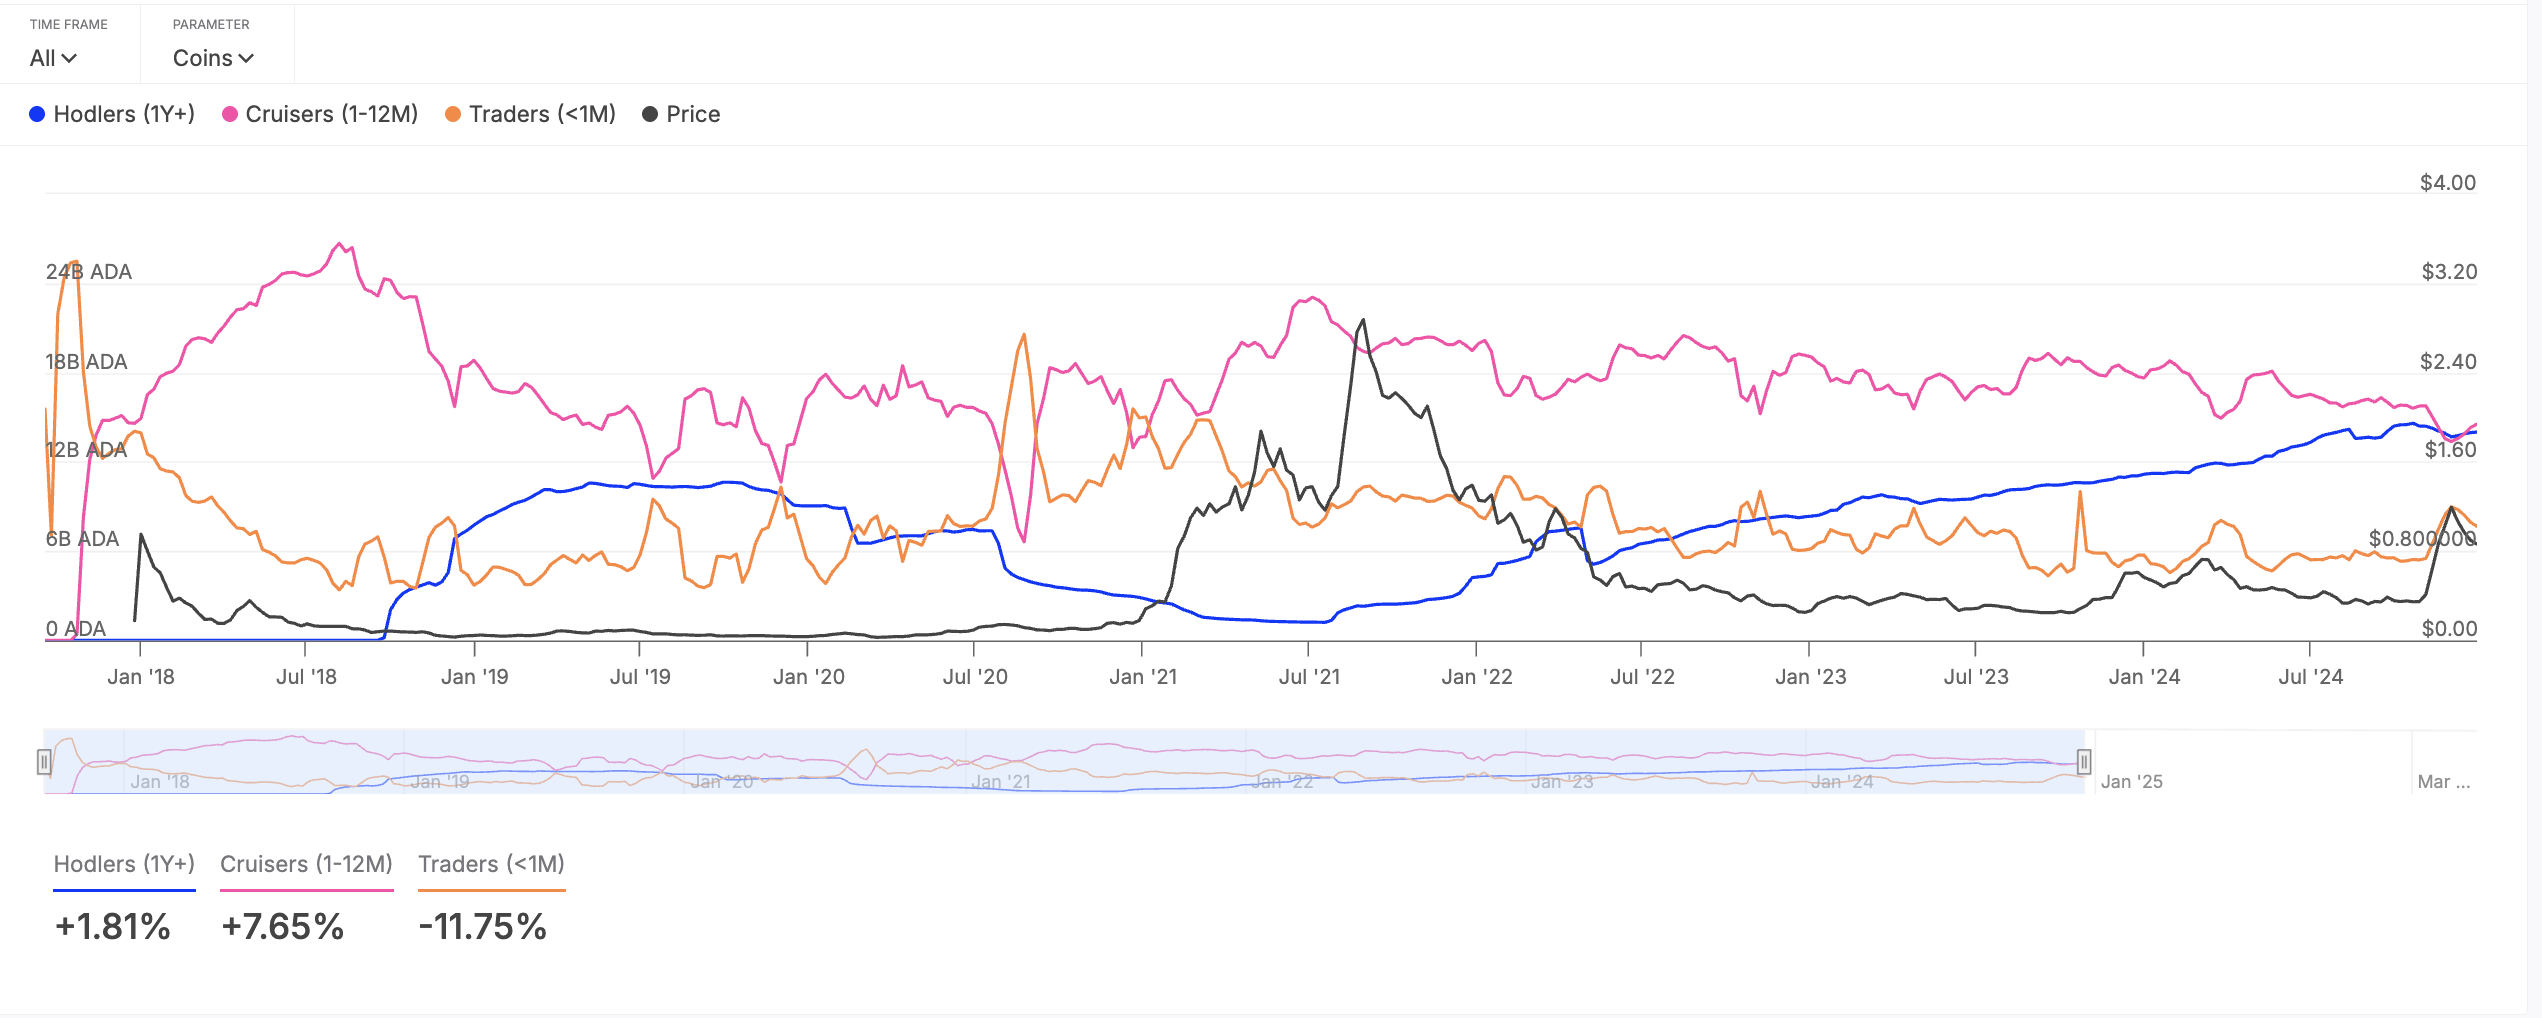 Cardano Balance by Time Held. Source: IntoTheBlock
Given their influence on short-term market trends, this drop in activity among STHs suggests a lack of confidence in ADA’s near-term recovery. If this wave of selling continues, the coin may struggle to find a solid support level unless long-term investors or institutional buyers step in to absorb the sell-offs.
Additionally, ADA’s funding rate across its derivatives market has remained negative, confirming the bearish bias against it. Per Coinglass, this is currently at -0.006%.
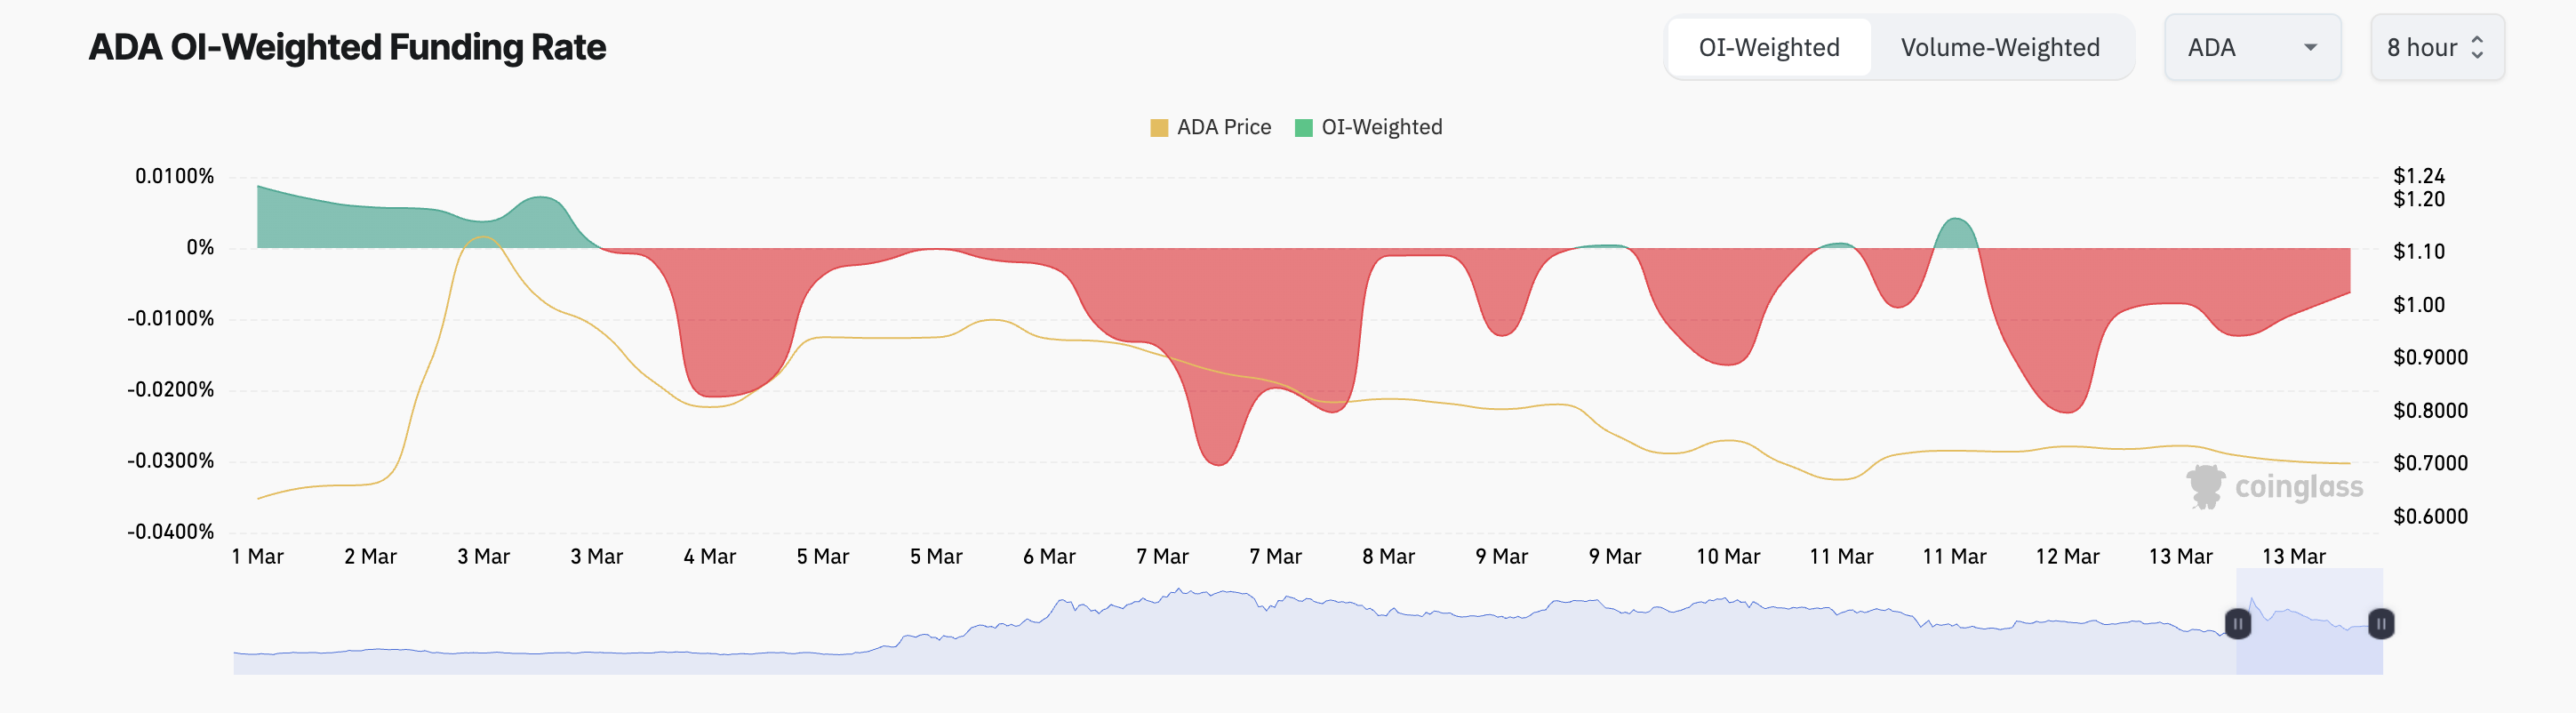 Cardano Funding Rate. Source: Coinglass
The funding rate is a periodic fee exchanged between long and short traders in perpetual futures contracts. It is designed to keep contract prices aligned with the spot market.
When it is negative, short traders are paying longs, indicating that bearish sentiment dominates, with more traders betting on price declines.
ADA Faces Increased Selling Pressure
ADA’s decline has pushed its price below the 20-day exponential moving average (EMA) on a daily chart. This indicator measures an asset’s average price over the past 20 trading days, giving weight to recent price changes.
When an asset’s price falls below this key moving average, it signals weakening market momentum and hints at a shift to a short-term downtrend. Traders see this as a bearish signal, suggesting increased selling pressure and the possibility of further declines.
If this holds, ADA’s price could drop to $0.60.
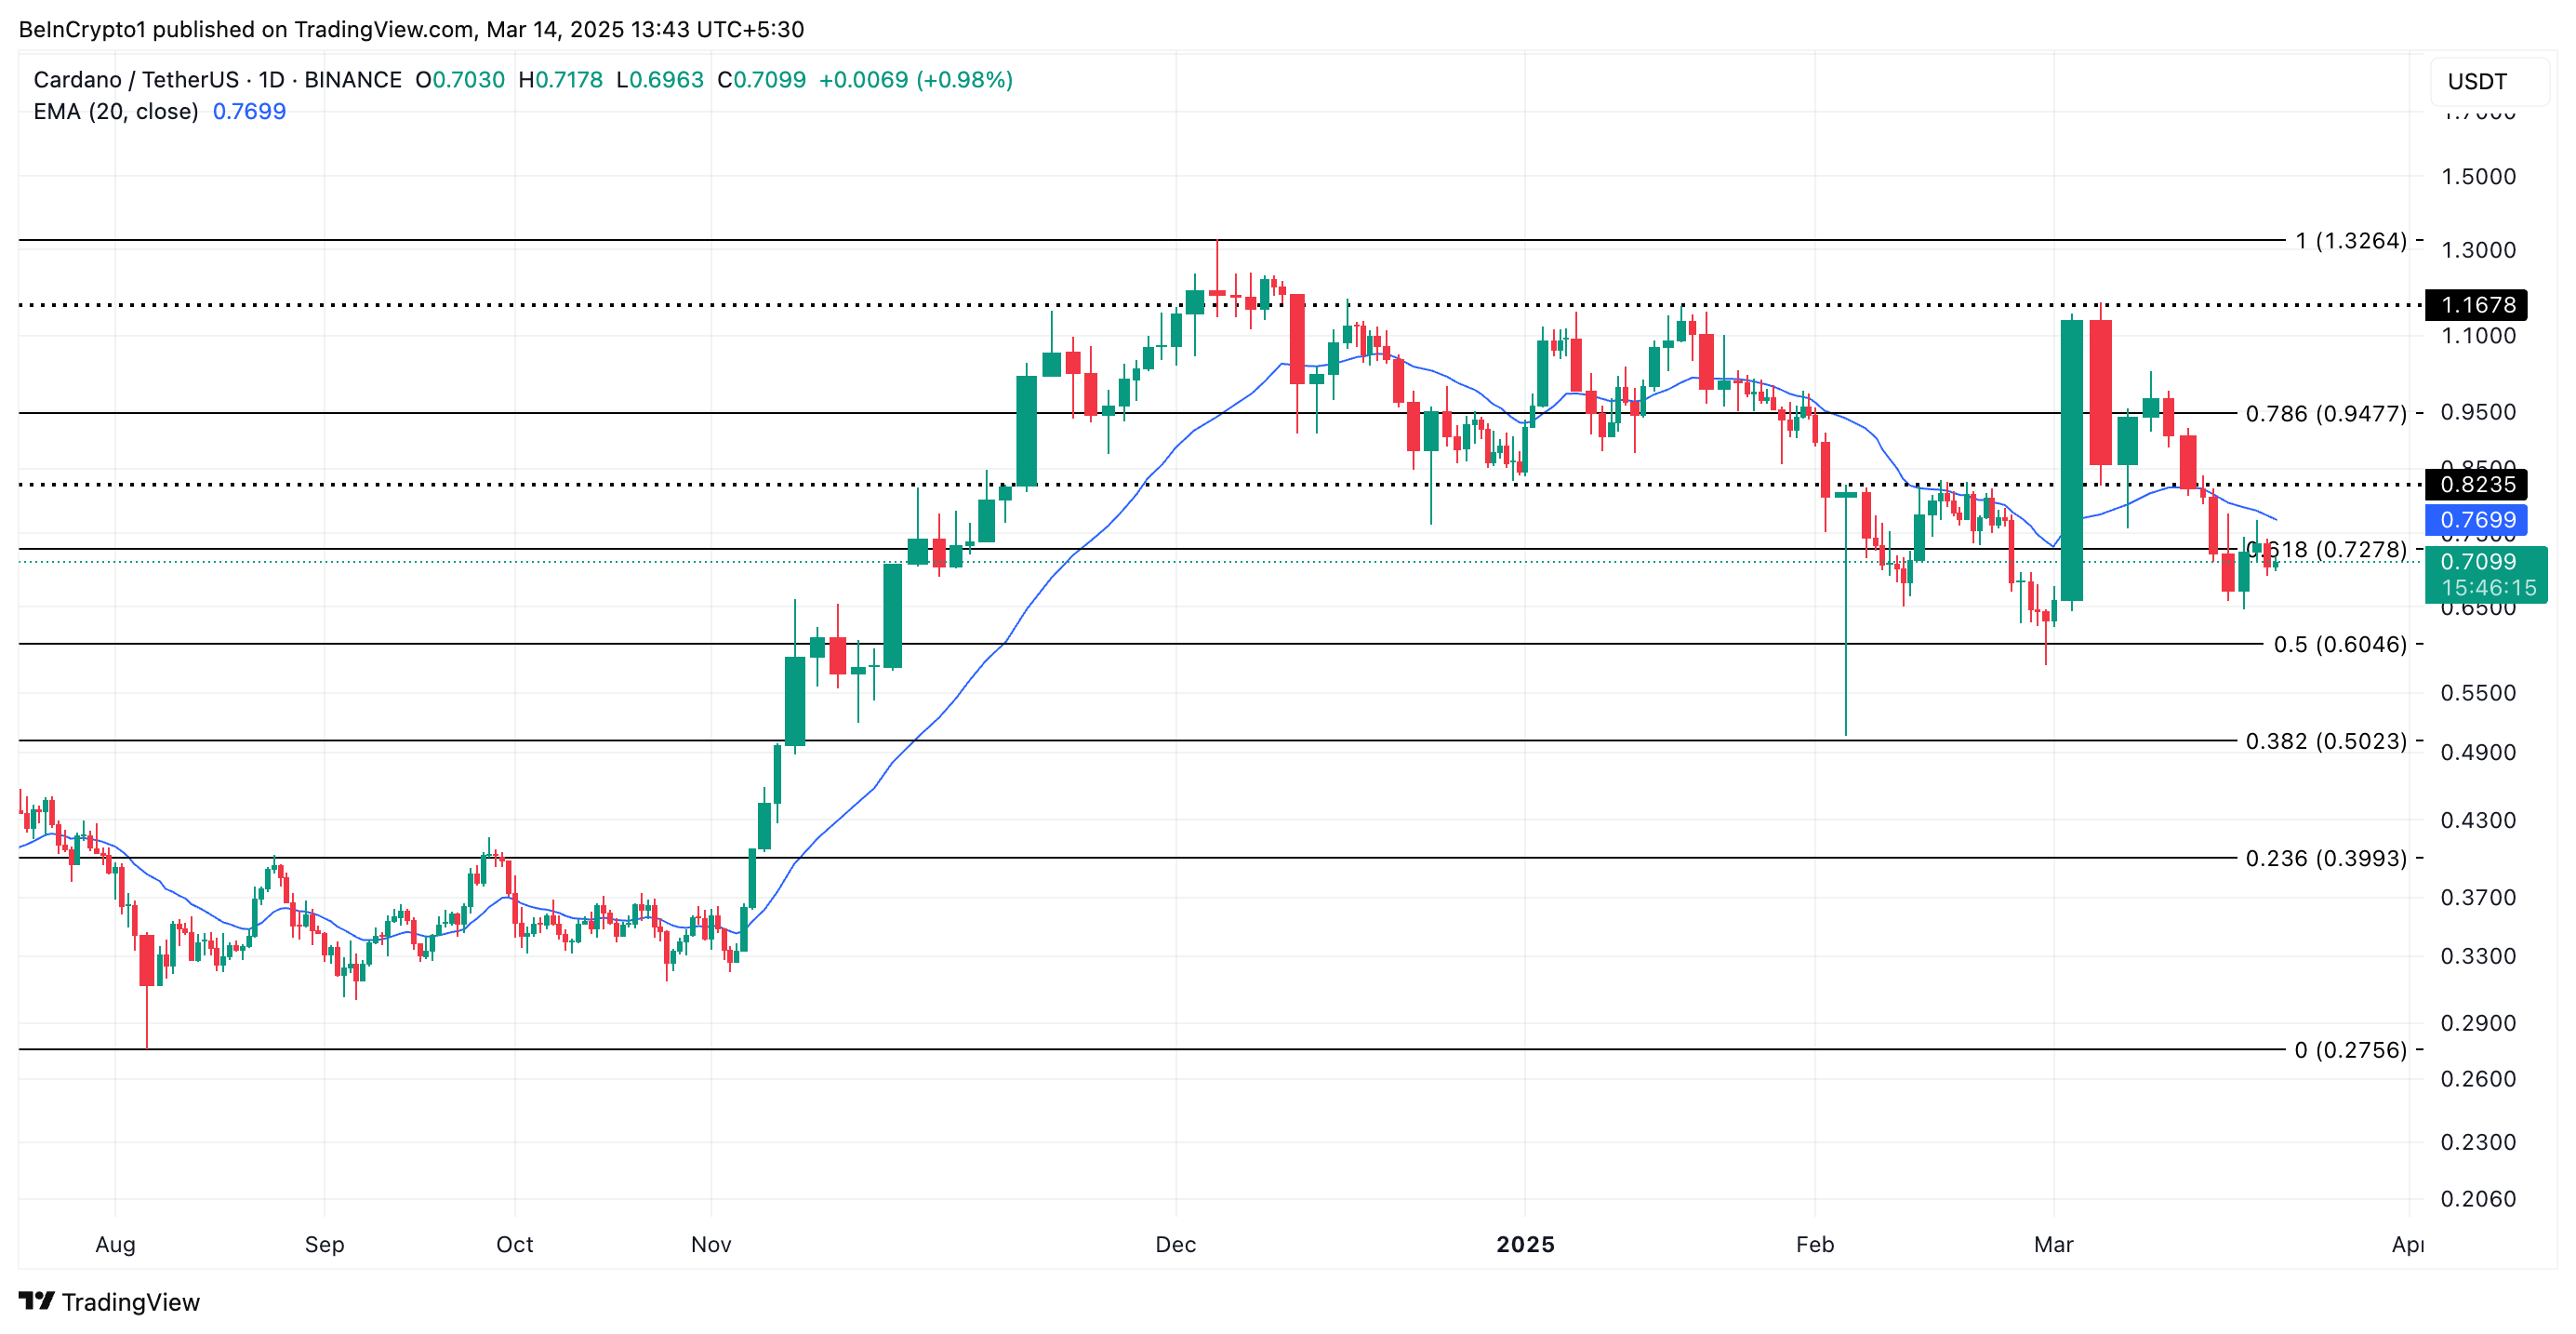 ADA Price Analysis. Source: TradingView
On the other hand, a bullish resurgence could trigger a break above the $0.72 resistance and a charge toward $0.82.
0
0

 Manage all your crypto, NFT and DeFi from one place
Securely connect the portfolio you’re using to start.


0
0

0
0